Anganwadi Poshan Chart 2026: Menu, Growth and Poster Guide
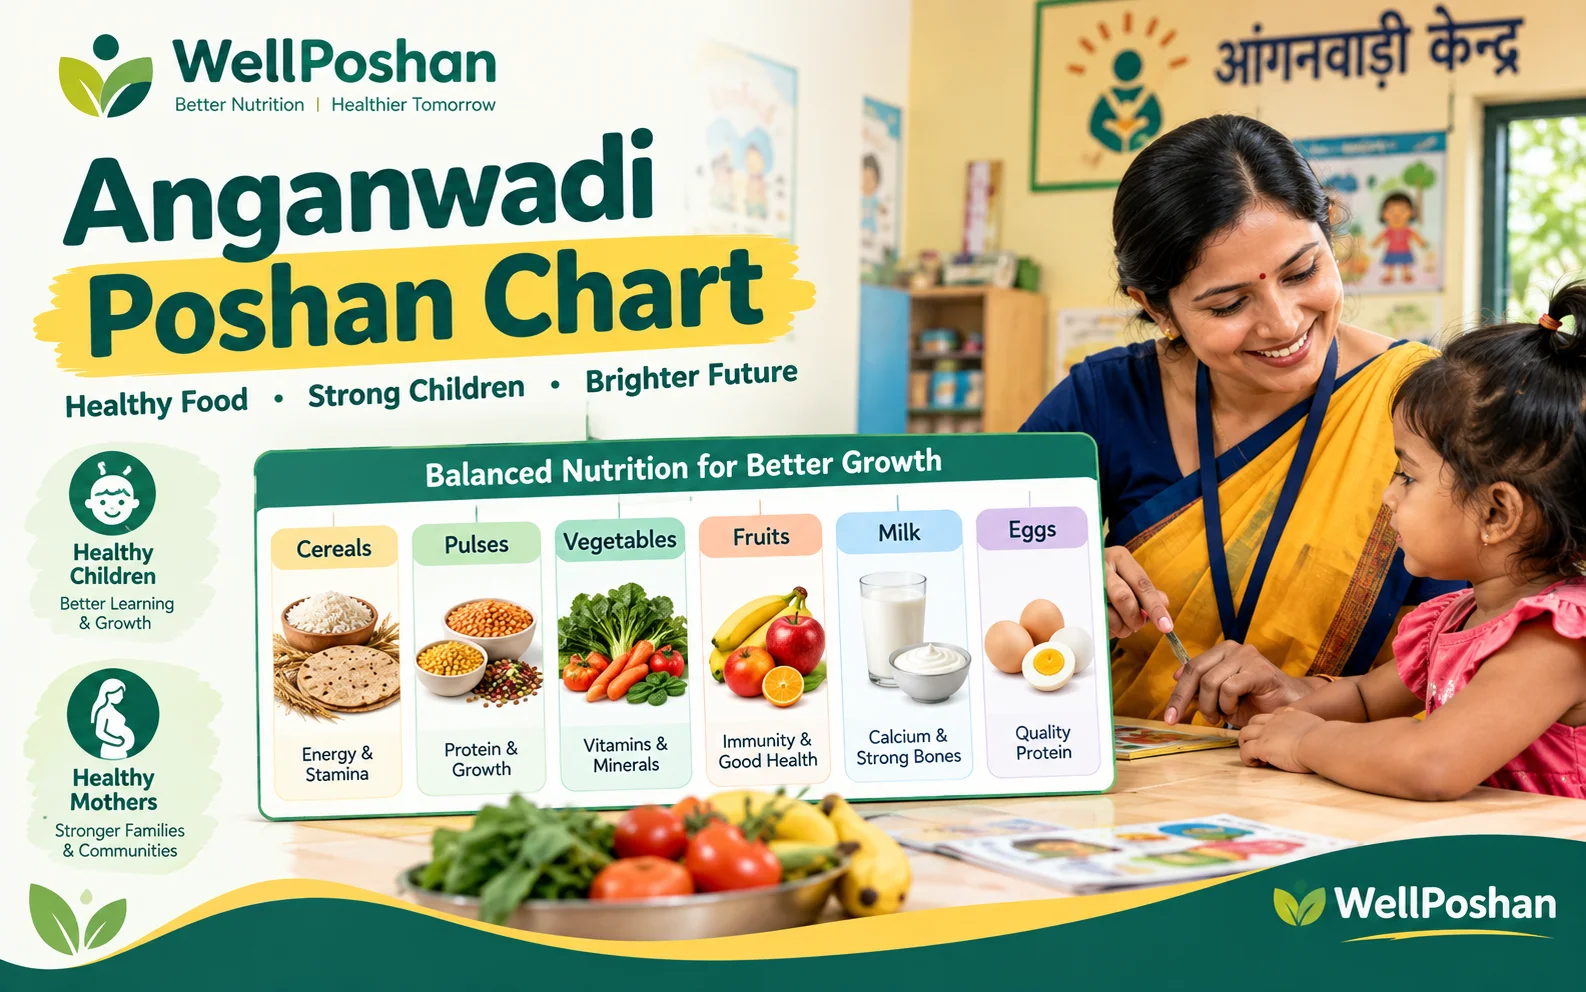
An Anganwadi Poshan Chart is a simple wall chart (or digital record) that shows what nutrition each beneficiary gets, when they get it, and how their growth is progressing, so that families, workers and supervisors can all see the same truth at a glance.
Walk into any good Anganwadi centre in 2026 and you will spot it within ten seconds: a bright, readable Anganwadi Poshan Chart near the door. Weekly menu on one side, growth tracking on the other, a Poshan Maah poster stuck right above it.
Walk into a weak one, and the chart is faded, outdated, or hiding behind a cupboard. Same scheme. Same budget line. Very different child outcomes.
This guide shows you how to build, read and use an Anganwadi Poshan Chart the right way, using the latest 2026 data from Saksham Anganwadi and Poshan 2.0, the nine-year-old Rashtriya Poshan Maah, and the Poshan Tracker.
What Is an Anganwadi Poshan Chart?
An Anganwadi Poshan Chart is not one single government form. It is a family of three charts that work together:
| Chart type | What it shows | Who looks at it |
|---|---|---|
| Poshan menu chart | Weekly hot cooked meal and Take-Home Ration (THR) schedule | Mothers, helpers, visitors |
| Growth monitoring chart | Weight, height, MUAC and nutrition status of each child | Anganwadi Worker (AWW), supervisor, CDPO |
| Poshan awareness chart | Poshan Maah messages, dietary diversity, hygiene, breastfeeding | Whole community |
Author POV: The most common mistake we see is treating these as three separate chores. Centres that link them (the menu says what was served, the growth chart shows what changed) catch malnutrition weeks earlier than centres that don’t.
Quick definitions
Saksham Anganwadi and Poshan 2.0: India’s integrated nutrition support programme. It brings together Anganwadi Services, Supplementary Nutrition, POSHAN Abhiyaan and the Scheme for Adolescent Girls.
Poshan Tracker: The Ministry’s mobile and web platform (rolled out 1 March 2021) that records attendance, growth monitoring and service delivery.
Anganwadi Poshan Aahar: The supplementary nutrition food given at the centre, either as a hot cooked meal or as Take-Home Ration.
Saksham Anganwadi and Poshan 2.0: Which Ministry Runs It?
Saksham Anganwadi and Poshan 2.0: Which Ministry Runs It?
The Ministry of Women and Child Development (MWCD) runs Saksham Anganwadi and Poshan 2.0.
What is Saksham Anganwadi and Poshan 2.0? It is the umbrella mission that replaced the older ICDS-era structure from 2021-22. It aims to fix nutrition through better food, better early learning and better monitoring. A “Saksham” centre is an upgraded one, with items like LED screens, water purification, smart learning aids and a Poshan Vatika, according to the Ministry’s own FAQ.
POSHAN Abhiyaan itself began on 8 March 2018 and was folded into this larger mission. Think of Abhiyaan as the movement, and Poshan 2.0 as the engine room.
Why the Anganwadi Poshan Chart Matters in 2026
Because scale without visibility is just noise. Here are the numbers that show why.
Five stats worth knowing
- Nearly 13.99 lakh Anganwadi Centres, around 13.30 lakh Anganwadi Workers and about 8.94 crore beneficiaries as of 31 July 2026 (Ministry of Women and Child Development data, reported by the Organiser).
- More than 7.2 crore children aged 6 months to 6 years, plus nearly 1.1 crore pregnant and lactating women, are in that group (same Ministry data).
- 97.87% of beneficiaries had completed Aadhaar e-KYC and face matching for Take-Home Ration by June 2026 (Ministry reply in Parliament, reported by The South First).
- NFHS-5 (2019-21) found 35.5% of under-5 children stunted, 19.3% wasted and 32.1% underweight (National Family Health Survey, IIPS).
- Poshan Tracker data from September 2023 showed 39% of child beneficiaries aged 0-6 stunted and 18% underweight (peer-reviewed analysis published on PubMed Central).
Why this matters for your chart: When 14 lakh centres feed data into one system, a chart that is wrong or outdated at your centre doesn’t just mislead your village. It pollutes the dataset everyone uses to decide policy.
Poshan Maah 2026: What Your Chart Must Reflect Right Now
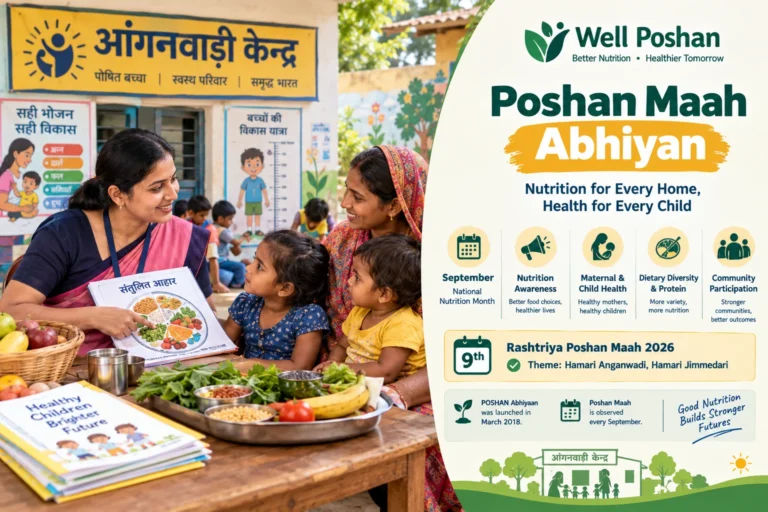
The 9th Rashtriya Poshan Maah runs 9 September to 8 October 2026. It was launched in Varanasi under the theme “Hamari Anganwadi, Hamari Jimmedari” (Our Anganwadi, Our Responsibility).
Its five focus areas:
- Dietary diversity and adequate protein
- Fresh, hot cooked meals
- Community ownership and accountability (including Anganwadi Management Committees)
- Nutrition linked with early childhood development
- Ten years of PMMVY, the maternity benefit scheme
The Ministry issued guidelines for Anganwadi Management Committees on 23 June 2026, and at least one committee meeting is expected at every centre during Poshan Maah.
Expert commentary (the why): This theme shifts the chart from “what the government gives” to “what the community checks.” That is why a modern Anganwadi Poshan Chart should carry a small accountability panel: committee meeting date, who to ask about THR, and the next growth-monitoring day.
Poshan Pakhwada, the fortnight-long drive that has run in March or April in recent years (April in 2026), uses the same logic. Poshan Maah is the big September push; Anganwadi Poshan Pakhwada is the mid-year refresher.
Nutrition Norms Your Anganwadi Poshan Chart Must Respect
A chart that looks pretty but feeds the wrong numbers is decoration. These are the benchmark norms under Poshan 2.0 supplementary nutrition:
| Group | Calories per day | Protein per day |
|---|---|---|
| Children 6 months to 6 years | 500 kcal | 12-15 g |
| Pregnant and lactating women | 600 kcal | 18-20 g |
| Children with Severe Acute Malnutrition (SAM) | 800 kcal | 20-25 g |
Important: Always verify against your state’s latest order, since states adapt menus and costs.
Growth cut-offs (WHO standards used in India)
- Stunting: height-for-age below -2 standard deviations (SD)
- Wasting: weight-for-height below -2 SD
- Underweight: weight-for-age below -2 SD
- SAM: weight-for-height below -3 SD, or MUAC below 11.5 cm (children 6-59 months)
- MAM (moderate acute malnutrition): weight-for-height between -3 and -2 SD, or MUAC 11.5 to under 12.5 cm
MUAC = Mid-Upper Arm Circumference, a colour-coded tape measure around the child’s upper arm.
The P-O-S-H-A-N Chart Framework (Copy This)
Most guides tell you what to put on a chart. We use a six-letter framework that tells you how to check it. Run every Anganwadi Poshan Chart through it.
| Letter | Check | Quick test |
|---|---|---|
| P | Protein in every slot | Does each day show dal, egg, milk, groundnut, soya or similar? |
| O | Own-region foods | Are ingredients local and seasonal, with millets (Shree Anna) included? |
| S | Simple visuals | Can a mother who can’t read understand it from icons and colours? |
| H | Hot and hygienic | Is the hot cooked meal clearly marked, with hand-wash reminders? |
| A | Accountability line | Is there a committee meeting date and a person to ask? |
| N | Next-visit tracking | Is the next weighing and Poshan Tracker entry date visible? |
Why it works: Each letter fixes a failure we see repeatedly. P fixes calorie-only menus. O fixes unrealistic “paper menus.” S fixes charts only supervisors can read. H protects against food safety slips. A fits the 2026 theme. N turns a static chart into a living one.
How to Make an Anganwadi Poshan Chart: A 7-Step Workflow
- Collect your state’s approved menu. Start with your state or district Poshan 2.0 order, not an internet template.
- List your beneficiary groups. 6 months to 3 years (THR), 3 to 6 years (hot cooked meal), pregnant and lactating women, adolescent girls where applicable.
- Map protein sources by day. Rotate pulses, eggs where permitted, milk, groundnut and soya so no two days feel identical.
- Add local seasonal produce. Use what your Poshan Vatika and nearby farms actually grow.
- Design for non-readers. Use big local-language text, food icons and colour blocks.
- Add the tracking strip. Weighing day, height measurement day, MUAC check and Poshan Tracker entry day.
- Review monthly. Refresh after every growth-monitoring cycle and replace it during Poshan Maah and Poshan Pakhwada.
Free Template: Weekly Anganwadi Poshan Chart (Sample)
This is a sample. Replace dishes with your state-approved menu.
| Day | Hot cooked meal (3-6 yrs) | Protein anchor | Local add-on |
|---|---|---|---|
| Monday | Vegetable khichdi | Moong dal | Seasonal greens |
| Tuesday | Roti, dal, sabzi | Toor dal | Carrot or radish |
| Wednesday | Millet upma with vegetables | Groundnut | Ragi or jowar |
| Thursday | Rice, dal, mixed vegetables | Chana or lentils | Local leafy vegetable |
| Friday | Egg curry with rice (or paneer/soya where eggs are not served) | Egg or soya | Tomato, onion |
| Saturday | Sweet dalia with jaggery | Milk or pulses | Seasonal fruit |
Tracking strip (bottom of chart): Weighing day: ___ | Height check: ___ | MUAC check: ___ | Committee meeting: ___ | Poshan Tracker update: ___
Before and After: A Transformation Example
Before (typical weak chart):
- Handwritten, faded, six months old
- Lists “dal-rice” for four days out of six
- No growth section, no meeting date
- Hangs behind the door
After (POSHAN-compliant chart):
- Printed in large local-language text with icons
- Different protein anchor each day, with a millet day
- Colour-coded growth strip with next weighing date
- Mounted at eye level near the entrance, beside a Poshan Maah poster
The content barely changed. Visibility, protein variety and follow-up did. That is the whole trick.
Illustrative Case Study: One Chart, One Quiet Win
This is an illustrative composite based on common patterns, not a named centre.
An Anganwadi in a mid-sized block had a chart showing “dal-rice” most days. Parents rarely asked about it because it said nothing useful. The worker redesigned it using the P-O-S-H-A-N framework: protein anchors, a millet day, a growth strip and a committee meeting date.
Within a cycle, two things changed. Mothers started asking why Wednesday was upma, which opened conversations about millets. And the worker spotted two children whose MUAC readings sat just below 12.5 cm early enough to refer them for follow-up, instead of noticing at the next quarterly review.
The lesson: A chart’s real job is to start conversations and trigger action, not to satisfy an inspection.
Poshan Maah Poster, Rangoli, Vatika and Matka Ideas
Use these during September, or any time you want to refresh your centre:
- Anganwadi Poshan Abhiyaan poster and Anganwadi Poshan Pakhwada poster: Keep one message per poster, such as “protein in every plate” or “wash hands before eating.” Use the official Poshan Abhiyaan logo exactly as published, without stretching or recolouring.
- Anganwadi Poshan Maah Rangoli and Poshan Abhiyaan Rangoli: Make designs from grains, pulses, millets and vegetables. A rangoli built from real food teaches dietary diversity better than any slogan.
- Poshan Vatika image: Photograph your own nutrition garden with date and crop labels. Original photos beat stock images for documentation.
- Poshan Matka image: Document community-contributed food collection drives with consent from families.
- Anganwadi Poshan Maah activities: Recipe demonstrations with local ingredients, Poshan Melas, ECCE Day activities, growth-monitoring camps, and a committee meeting.
- Anganwadi Poshan Kit: Check what your state supplies (growth monitoring tools, ECCE and nutrition materials) and list it on your chart’s tracking strip so nothing goes missing.
Poshan Tracker App and Height-Weight Calculator: Pairing Digital with Paper
The Anganwadi Poshan Tracker is the digital twin of your wall chart. As of March 2026, the Poshan Tracker had 14,03,170 centres and 8,95,29,425 eligible beneficiaries registered (Ministry of Women and Child Development fact sheet).
If you use the Anganwadi Poshan Tracker App, remember that:
- It records attendance, growth monitoring, home visits and THR distribution.
- It can run face matching in offline mode where networks are poor.
- The Anganwadi Poshan Calculator Height Weight logic compares measurements with WHO standards to flag stunting, wasting and underweight, so careful measuring matters more than fast typing.
Simple formula (to understand what the app does):
Z-score = (child’s measurement − reference median) ÷ reference standard deviation
A Z-score below -2 flags concern. Below -3 flags severe concern. Measure twice, enter once.
Pairing rule: Whatever the app says, your wall chart should show the same weighing date. Mismatched dates are an easy audit red flag.
Word List with Examples
| Term | Meaning | Example |
|---|---|---|
| THR (Take-Home Ration) | Dry or pre-mix food taken home for children 6 months to 3 years and for pregnant and lactating women | A mother collects monthly THR packets after face matching |
| HCM (Hot Cooked Meal) | Fresh meal served at the centre to children 3 to 6 years | Vegetable khichdi served on Monday |
| SAM | Severe Acute Malnutrition | A child with MUAC 11.2 cm is flagged as SAM |
| MAM | Moderate Acute Malnutrition | MUAC of 12.0 cm falls in the MAM band |
| Stunting | Low height for age, a sign of long-term undernutrition | A 3-year-old much shorter than the standard for age |
| Wasting | Low weight for height, a sign of recent or acute undernutrition | A child who lost weight after repeated diarrhoea |
| Underweight | Low weight for age | A child below -2 SD on the weight-for-age chart |
| MUAC | Mid-Upper Arm Circumference | The colour-coded tape around the upper arm |
| ECCE | Early Childhood Care and Education | Play-based learning with Aadharshila activities |
| AMC | Anganwadi Management Committee | A committee meeting held during Poshan Maah |
| Poshan Vatika | Nutrition garden at or near the centre | Spinach, papaya and drumstick grown for meals |
| Poshan Matka | Community food-collection pot | Families contributing grain or jaggery for malnourished children |
| Dietary diversity | Eating from many food groups daily | Dal + vegetable + millet + fruit in one day |
| First 1,000 days | Period from conception to age two, when nutrition shapes lifelong health | Counselling a pregnant woman on iron and protein |
| Jan Andolan | People’s movement approach to nutrition | Village-wide Poshan Maah rallies |
Common Mistakes to Avoid
- Copying a viral template. States differ. Your chart must match your approved menu.
- Counting calories, ignoring protein. The 12-15 g and 18-20 g protein norms matter as much as energy.
- Using only English text. If families can’t read it, it doesn’t exist.
- Never updating. A chart showing last year’s theme signals neglect.
- Skipping the accountability panel. The 2026 theme is about shared responsibility, so show who to ask.
- Mismatch with the Poshan Tracker. Differing dates and numbers raise doubts about data quality.
- Using the logo carelessly. Stretch, recolour or crop it and your poster looks unofficial.
Conclusion: Make Your Anganwadi Poshan Chart Work for You
A well-built Anganwadi Poshan Chart does three jobs at once: it informs families, guides workers and strengthens accountability. In a year when Poshan Maah 2026 asks “Hamari Anganwadi, Hamari Jimmedari,” the chart is where that responsibility becomes visible.
Start with your state menu. Run it through the P-O-S-H-A-N framework. Pair it with your Poshan Tracker entries. Review it monthly. Small, visible, consistent: that is how a wall chart becomes a nutrition tool.
Key Takeaways
- An Anganwadi Poshan Chart is really three charts: menu, growth and awareness. Link them.
- Saksham Anganwadi and Poshan 2.0 is run by the Ministry of Women and Child Development.
- Poshan Maah 2026 (9 September to 8 October) runs under “Hamari Anganwadi, Hamari Jimmedari.”
- Use the P-O-S-H-A-N framework: Protein, Own-region foods, Simple visuals, Hot and hygienic, Accountability, Next-visit tracking.
- Respect norms: 500 kcal and 12-15 g protein for children, 600 kcal and 18-20 g for pregnant and lactating women, 800 kcal and 20-25 g for SAM.
- Keep the wall chart and Poshan Tracker dates in sync.
Summary
This guide explained what an Anganwadi Poshan Chart is, who runs the scheme, which 2026 numbers matter, and how to build a chart using a six-part framework, a 7-step workflow and a ready template. It also covered Poshan Maah poster, rangoli, Poshan Vatika and Poshan Matka ideas, a glossary with examples, and the mistakes that quietly weaken a chart.
FAQs
1. What is an Anganwadi Poshan Chart?
An Anganwadi Poshan Chart is a visual record at the centre showing the weekly meal and THR schedule, children’s growth status and key nutrition messages. It can be a wall chart, a digital record in the Poshan Tracker, or both.
2. Who should update the Anganwadi Poshan Chart, and how often?
The Anganwadi Worker usually updates it, with supervisor review. Refresh the menu whenever the state menu changes, and the growth strip after every weighing cycle. Replace awareness content during Poshan Maah and Poshan Pakhwada.
3. Which ministry is responsible for the Anganwadi Poshan Chart and Saksham Anganwadi and Poshan 2.0?
The Ministry of Women and Child Development runs Saksham Anganwadi and Poshan 2.0. Your Anganwadi Poshan Chart should follow its norms and your state’s approved menu.
4. Can I use the Poshan Tracker instead of an Anganwadi Poshan Chart on the wall?
No. The Poshan Tracker is for workers and supervisors. A wall-mounted Anganwadi Poshan Chart keeps families informed and supports community accountability, which is the heart of the 2026 Poshan Maah theme.
5. What should an Anganwadi Poshan Chart include for Poshan Maah 2026?
Include the theme “Hamari Anganwadi, Hamari Jimmedari,” a protein-rich weekly menu, millet and local foods, the next growth-monitoring date, a committee meeting date and one clear awareness message such as dietary diversity.
Sources
- UNICEF India: Poshan Maah 2026
- Drishti IAS: 9th Rashtriya Poshan Maah 2026
- Organiser: Poshan Maah 2026 and Anganwadi nutrition hubs
- The South First: Poshan Tracker verification
- Poshan Tracker fact sheet (Jharkhand State News)
- PubMed Central: India’s Poshan Tracker
- WCD: Mission Saksham Anganwadi and Poshan 2.0
Thank You For Reading!